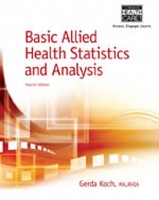
 Author: Gerda Koch, MA, RHIA; Technical Review by Catherine Ward, MBA, RHIA and Stephanie Donovan, MBA, RHIA
Publisher: Cengage Learning – 356 pages
Book Review by: Sonu Chandiram
The health care industry has become the largest contributor to the gross domestic product of the United States, with data showing that today the share is over 18 percent. By 2022, it is estimated to be 20 percent or more: over $5 trillion.
And if you look at employment growth numbers in different sectors of our economy since the last recession began in 2008 up to now, you will note that while many industries lost tens to hundreds of thousands of jobs, hiring in health care continued to expand. This may be due to our aging population as well as fewer births, compared to other countries, particularly in Asia.
As more and more people enter health care, the demand for trained workers in that industry will continue to grow, including for those who keep records and make sense of them.
This book has been developed for students of health care who are seeking positions in health information technology and management, as well as for those professionals already in these fields. This book enables you to not only learn how to record data in health care, but also to apply statistical formulas, and test yourself on what you learned and understood.
Computational problems are provided for you to solve, because the best way to learn anything is to apply what you have learned. And the more you apply yourself in learning and figuring out the solutions to the problems, the more you learn and become proficient with them. This is true in any area of learning.
The coverage of this book is quite extensive and below is a bird’s eye view of what you will find in its 15 chapters and five appendices:
- Statistical Terminology and Health Care Data
- Frequency Distributions and Tables
- Health Care Overview and Patient Data Collection
- Mathematical Review
- Census
- Percentage of Occupancy
- Length of Stay
- Hospital Mortality Rates
- Obstetrical-Related Rates
- Autopsy Rates
- Miscellaneous Rates
- Vital Statistics Data / Rates
- Measures of central Tendency and Dispersion
- Graphic Representation
- Fundamentals of Research
Appendices: Glossary, Formulae, Abbreviations, Answers to the Self-Tests and Chapter Tests, Quick References
The material in this book has been organized and is presented in a way that is conducive to quicker learning. You may have come across the SQ4R study method, and this book uses many of the elements in it. SQ4R stands for: Survey, Question, Read, Recite, Review, (w)Rite.
At the beginning of each chapter, you are provided a sort of survey with a Chapter Outline of the contents and your Learning Objectives. These prompt you to question: “what am I going to find in this chapter that is new to me?”
You get your answers as you read each section in that chapter and understand what is discussed, and recite aloud the key points you learned in the effort to remember it. You then review the material and continue the effort to understand and remember it. As a final effort to remember what you learned, you write it down.
Here is what you will encounter as you go through the 4R process:
What follows the chapter outline and learning objectives are: Preliminary Questions and Notes. Then, discussions of the various topics in the chapter are laid out. Self-Tests are provided to you throughout the chapter to enable you to find out what you learned and understood.
You will find a Summary of points towards the end of each chapter, followed by a Chapter Test. All the material is presented in the chapter are small portions with lots of headings. This makes digesting the material much quicker, and the end result, which is retention, is more easily achieved. All in all, this valuable book is an outstanding learning tool.


